Eye-Level Wins: Optimizing Retail Endcap Logos
Introduction – The 35% Advantage at a Glance
In today’s fiercely competitive retail landscape, every centimeter of shelf space can make a measurable difference to brand performance and bottom-line results. Decades of in-store research have confirmed a simple but powerful rule: products placed at eye level consistently attract around 35% more attention than those relegated to lower or higher tiers. This so-called “golden zone” isn’t just a merchandising myth — it’s a proven lever for lifting sales, improving category share, and enhancing brand recall.
Yet, despite the clear evidence, many executive teams still rely on sporadic in-person audits and manual reporting to monitor how products are actually presented in-store. These traditional approaches are slow, costly, and often leave critical gaps between scheduled reviews — gaps that can add up to millions in lost opportunity. With thousands of stores, hundreds of SKUs, and rapid planogram changes, it’s easy for even the best strategies to get lost on the shelf.
Enter the era of AI-powered visual analytics. By leveraging modern computer vision, merchandisers and brand managers can now transform ordinary aisle photos into a source of real-time, actionable intelligence. Every snapshot taken by a field rep or captured by an in-store camera can be instantly analyzed, showing exactly where product logos land on the shelf — and, crucially, whether they’re securing that coveted eye-level placement or slipping out of the shopper’s line of sight.
This shift is not just about better data — it’s about enabling faster, smarter decisions at the boardroom level. When executives have up-to-date, store-by-store visibility into logo placement, they can allocate trade budgets more effectively, intervene where compliance is slipping, and launch packaging or display refreshes with surgical precision. What was once an opaque “last mile” of retail execution is now fully transparent, giving C-level leaders a new level of control over the variables that move revenue and market share.
Ultimately, optimizing for eye-level is no longer a guesswork game. With the right analytics in place, brands can quantify the impact of their shelf presence, identify where adjustments are needed, and ensure their products are always positioned to win the customer’s attention — where it matters most.

Eye-Level Economics – From Attention Lift to EBITDA
Eye-level shelf placement is much more than a marketing best practice — it’s a proven driver of tangible business results that can move the needle on critical financial metrics. For C-level executives, understanding the economics behind this “golden zone” is key to unlocking new sources of growth and efficiency in today’s retail environment.
Translating Attention Into Financial Impact
When products are positioned at eye level, shoppers notice them first. This isn’t just anecdotal: studies have shown that a 35% increase in attention at eye level often translates directly into higher unit velocity, increased basket size, and improved inventory turns. In practical terms, that means more sales per square meter and more efficient use of promotional budgets.
Imagine shifting just 10% of your high-priority SKUs from less-visible positions to eye-level in a large retail chain. The resulting uplift in visibility can lead to mid-single-digit revenue growth chain-wide, often with a return that far exceeds the impact of adding weeks of trade promotions or deep discounting. Over time, this creates a compounding effect on gross margin, as higher sales velocity means less reliance on costly incentives to move stock.
Optimizing Trade Spend and Planogram Compliance
The C-suite is increasingly focused on ROI from every dollar spent in-store, especially as brands and retailers scrutinize trade promotion effectiveness. Eye-level placement enables companies to reallocate trade spend from blanket promotions to targeted execution, prioritizing those SKUs and stores where eye-level gains will deliver the greatest incremental impact.
Furthermore, planogram compliance — ensuring products are displayed according to the optimal layout — is no longer a nice-to-have. Inconsistent execution across stores can erode the benefits of even the most well-designed shelf strategies. Modern analytics can quantify compliance rates, highlight gaps, and provide clear direction on where corrective action will drive the greatest return on investment.
Aligning With What Executives Are Searching For
Terms like “shelf audit ROI,” “planogram compliance,” and “endcap optimization” are surging in popularity on platforms like Google Trends, underscoring that C-level leaders are actively seeking ways to measure and maximize shelf performance. With retailers facing rising costs and ever-tighter margins, these concepts are becoming central to boardroom conversations about operational efficiency and growth.
From Insights to EBITDA
The cumulative effect of these improvements — higher unit sales, optimized trade spend, and tighter planogram execution — rolls up directly to EBITDA. By treating eye-level optimization as a strategic lever, executive teams can drive not just incremental sales, but sustainable improvements in profitability and competitive advantage.
In summary, eye-level placement is a board-level opportunity hiding in plain sight. It delivers measurable value across revenue, margin, and operational KPIs, giving decision-makers a powerful, data-driven tool to transform retail execution into enterprise-level wins.
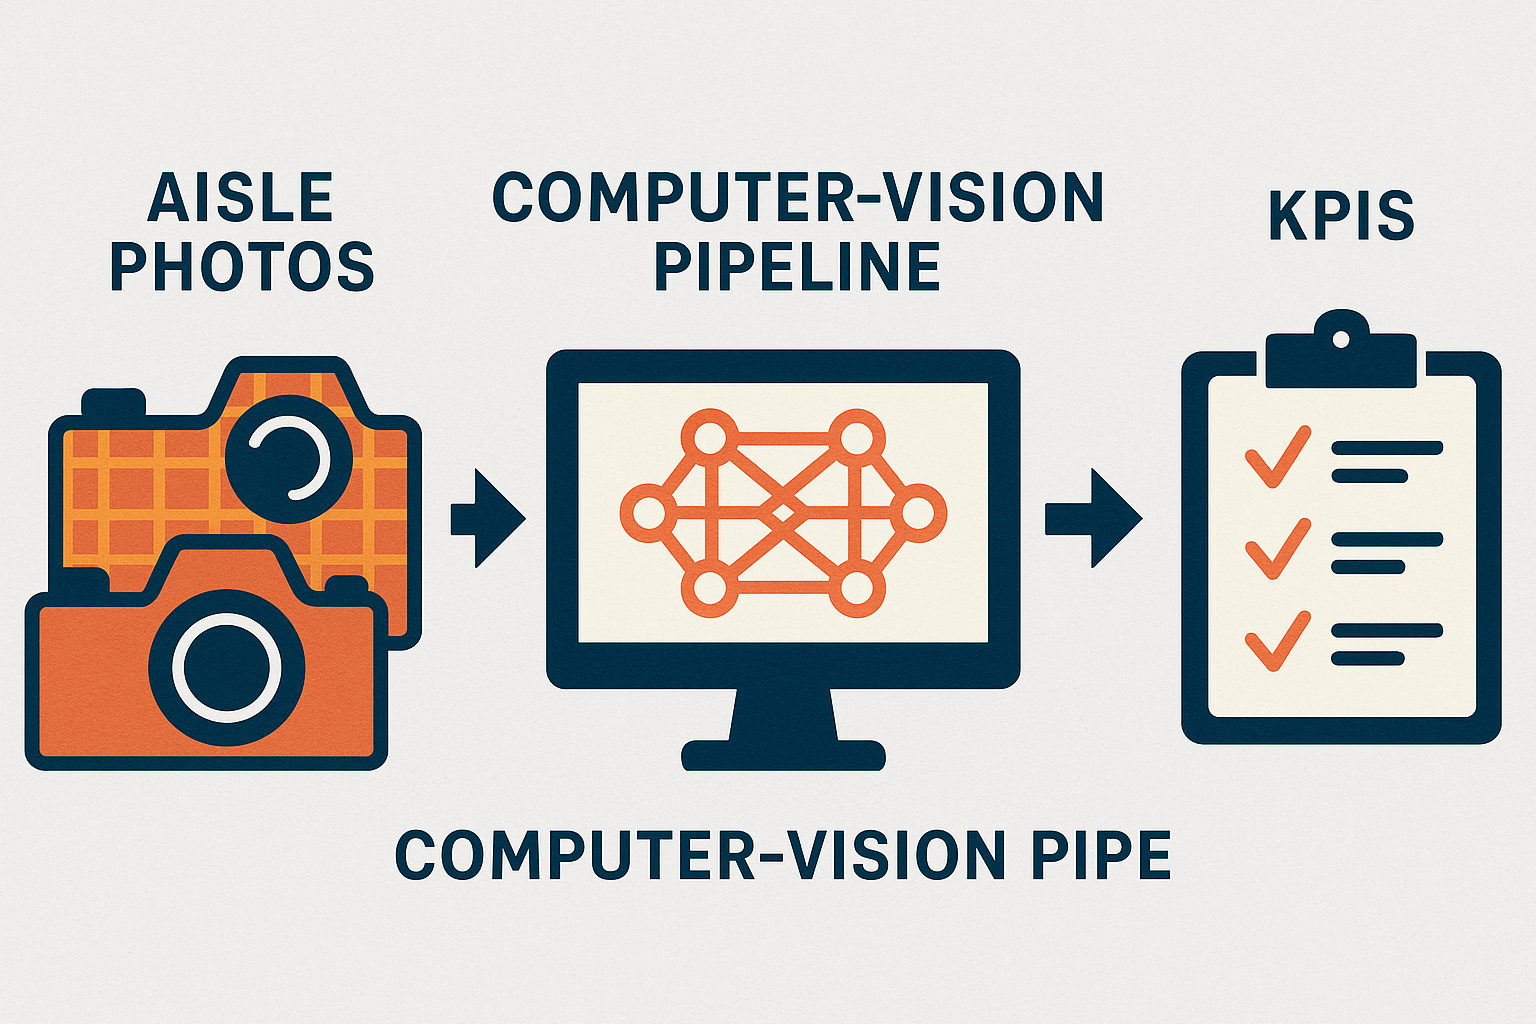
From Aisle Photos to KPIs – The Computer-Vision Pipeline
For today’s retail leaders, the challenge isn’t just about knowing that eye-level matters — it’s about having real, scalable visibility into what’s happening on every shelf, in every store, every day. Traditional manual audits and sporadic field reports fall short in both frequency and accuracy. This is where computer vision transforms the game, turning simple aisle photos into a continuous stream of KPIs that empower fast, strategic action.
Capture: Every Image Becomes an Asset
The process begins on the ground, where field reps, store managers, or even in-store cameras routinely capture images of shelves and endcaps. With smartphones now ubiquitous, collecting high-quality photos is both low-cost and unobtrusive. Smart edge devices can even filter out blurry or poorly angled shots, ensuring data quality from the outset.
Detect: Logos, SKUs, and Product Placement
Once images are collected, they’re uploaded to cloud-based AI platforms where advanced algorithms do the heavy lifting. Using deep learning models for logo recognition and object detection, the system identifies each product, its brand, and precisely where it appears on the shelf. APIs such as the Brand Recognition API and Object Detection API — already widely adopted in retail tech — enable this level of instant, automated analysis, delivering results in seconds rather than days.
These tools not only confirm the presence of the right brands but also measure the vertical (eye-level) position of each logo and flag products that are out of compliance with planogram standards. Over time, the system builds a comprehensive digital record of shelf execution across locations, allowing retailers and brands to spot patterns and exceptions at scale.
Quantify: Turning Visual Data Into KPIs
The final step is translating detection into metrics that matter. Computer vision platforms automatically calculate critical indicators such as:
Eye-level hit rate: The percentage of products and logos occupying the optimal vertical shelf band.
Share-of-shelf: The relative presence of each brand compared to competitors.
Facings count: The number of visible product fronts for every SKU.
These metrics feed directly into BI dashboards, delivering store-by-store comparisons, trend analysis over time, and instant alerts when compliance slips. C-level executives can access these insights remotely, ensuring they always have a pulse on real-world execution without waiting for lagging manual reports.
Strategic Impact: Fast, Scalable, and Always-On
By automating shelf monitoring through AI-powered APIs, companies reduce the margin for human error, scale their audit capability to thousands of locations, and unlock near real-time reporting. This agile approach is rapidly gaining traction; the global retail computer-vision market is projected to surpass $12.5 billion by 2033, growing at more than 25% CAGR. The reason is clear: when every aisle photo becomes a source of actionable intelligence, the entire organization moves faster and smarter.
For C-level leaders, this isn’t just a technology story — it’s a strategic advantage. A modern computer-vision pipeline delivers accurate, timely KPIs that fuel boardroom decisions, turning shelf data from a static snapshot into a living, breathing source of competitive edge.

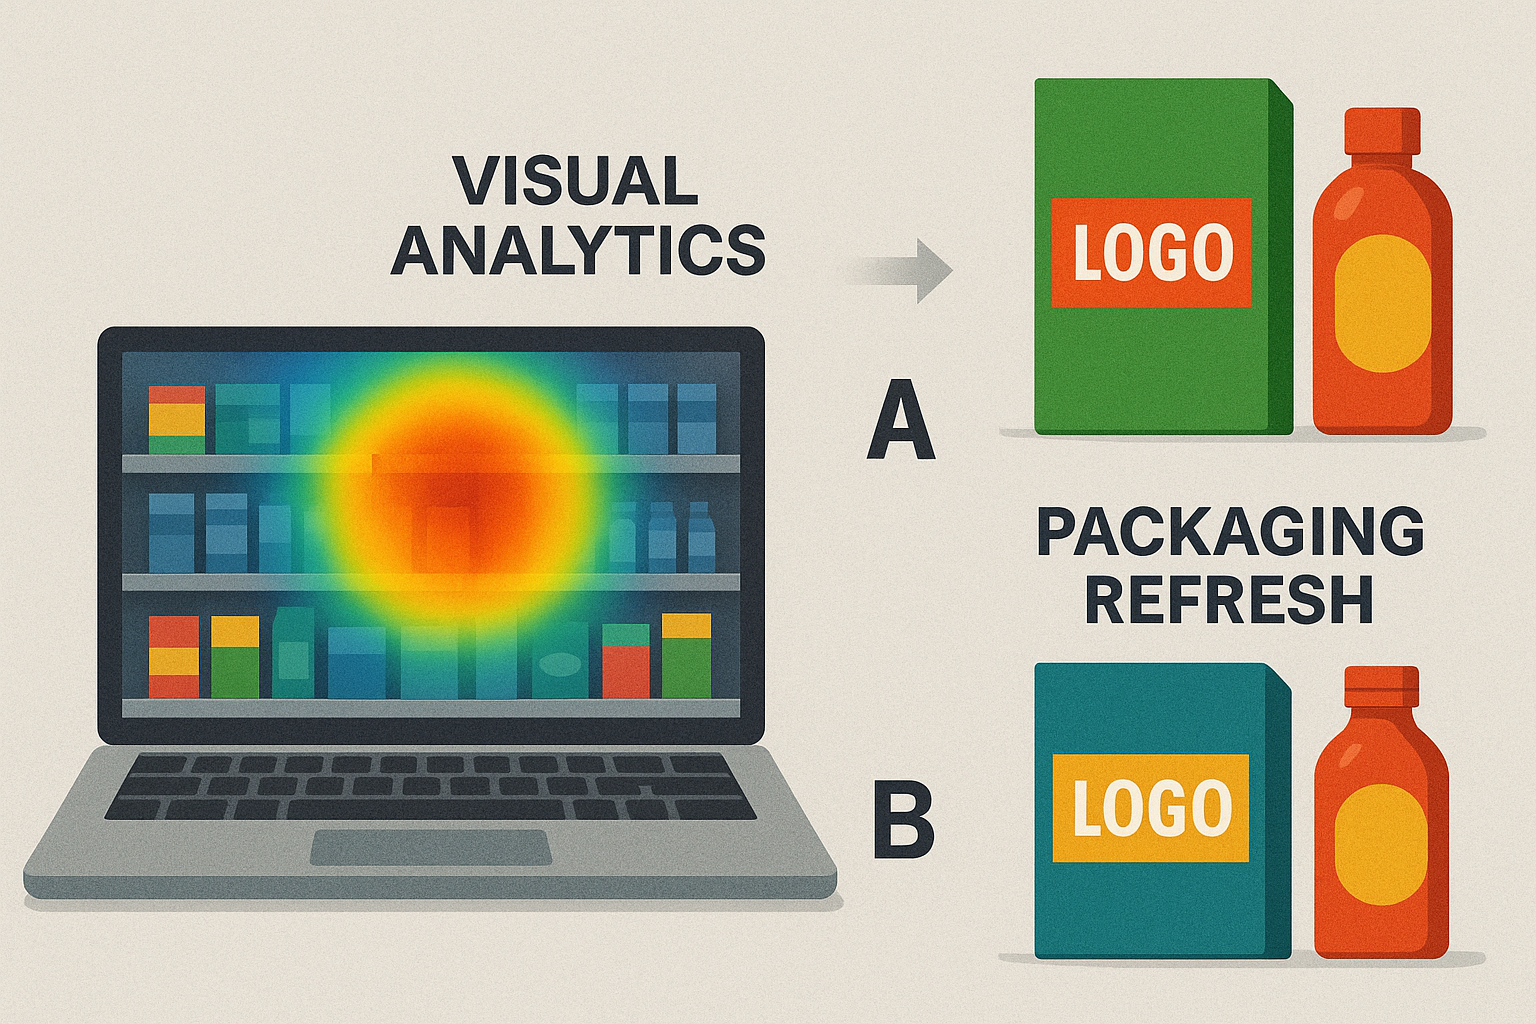
Heat-Mapping the Sweet Spot – Visual Analytics for Rapid Wins
One of the most transformative breakthroughs in modern merchandising is the use of visual heatmaps to instantly reveal where brands are capturing attention — and where opportunities are being missed. For C-level executives, heatmap analytics provide a compelling bridge between shelf data and business impact, making it possible to move from static reports to dynamic, actionable insights.
Visualizing Shelf Performance at Scale
Heatmaps aggregate thousands of shelf photos, overlaying them to highlight where logos consistently appear in the shopper’s line of sight — and, just as importantly, where they’re absent. This color-coded visualization provides a direct, intuitive view of product placement patterns across all stores, product lines, and display types. Instead of sifting through spreadsheets or relying on anecdotal feedback, decision-makers can see at a glance which brands and SKUs dominate the “eye-level zone” and which are relegated to the periphery.
Pinpointing Non-Compliance and Missed Opportunities
With heatmaps, non-compliant stores are no longer hidden in the noise of regional averages. The technology quickly surfaces outliers — locations where products are consistently misplaced, where brand logos slip below or above optimal positioning, or where promotional displays don’t match planogram strategy. C-level teams can direct attention and resources to specific stores or regions that are falling short, driving focused interventions and maximizing the return on merchandising investments.
Overlaying Attention Metrics with Sales Lift
The real power of heatmaps emerges when visual data is cross-referenced with sales performance. By overlaying attention metrics with real-world sales results, executives can identify the high-ROI adjustments that make the biggest impact. For example, moving a logo up by just a few centimeters may produce greater sales lift than a costly packaging overhaul or additional promotional spend. These data-driven tweaks — made visible through heatmaps — unlock rapid, measurable wins that can be replicated across the retail network.
Driving Agility in Retail Execution
Heatmap analytics do more than just report on the status quo; they empower organizations to act quickly. With near real-time feedback, brands and retailers can experiment with display changes, monitor the effect immediately, and course-correct without waiting weeks for results. This agile approach shortens the feedback loop from months to days, accelerating the pace of retail innovation and competitive response.
Keywords That Matter to Executives and Search Engines
In today’s digital-first landscape, phrases like “AI shelf heatmaps,” “visual merchandising analytics,” and “loss-recovery alerts” are trending upward in search popularity. Integrating these concepts not only ensures that business leaders find the insights they need but also positions companies at the forefront of modern retail strategy.
In summary, heatmap-driven visual analytics provide C-level leaders with a powerful lens to spot both problems and possibilities, enabling faster, smarter merchandising decisions and driving measurable gains — all with clarity and confidence.
Design-Loop Acceleration – From Insight to Packaging Refresh
The shelf is not only a battleground for visibility — it’s also a test lab for brand design. In the past, packaging refreshes or logo adjustments followed slow, risk-laden cycles. Brands relied on periodic audits, delayed sales feedback, and lengthy agency iterations before committing to costly production runs. Today, data-driven design loops powered by visual analytics are fundamentally changing this process, creating a new era of agile packaging innovation.
Closing the Feedback Loop with Real-World Shelf Data
Instead of guessing what works, executives now have concrete evidence — pulled from thousands of shelf images — showing how different logo sizes, colors, and placements perform in real stores. Visual heatmaps and attention metrics reveal, with pinpoint accuracy, which design elements grab shoppers’ eyes and which fade into the background. With these insights, creative teams can generate data-backed mock-ups that are more likely to succeed before a single new box hits the shelf.
Rapid A/B Testing in Live Retail Environments
Modern visual analytics platforms enable fast, low-risk experiments. Brands can pilot multiple packaging variants across selected stores, then monitor performance in near real-time. Instead of waiting months for conclusive results, executives receive instant feedback on which designs drive more engagement and higher sales. This agile approach often cuts the traditional refresh timeline from a year or more to just six weeks, enabling companies to respond quickly to shifting trends, seasonal opportunities, or competitor moves.
Aligning Design with Market Timing and Shopper Behavior
Successful packaging isn’t just about looking good — it’s about being seen at the right time. With access to search trends and shopper analytics, C-level leaders can synchronize packaging updates or endcap refreshes with peak demand periods. For example, aligning a snack’s packaging redesign with the “back-to-school” surge or a gifting item’s new look ahead of the holidays maximizes impact and ROI. Real-time data ensures that creative investments are matched to real market conditions, not just intuition.
De-Risking Major Design Decisions
Perhaps most importantly, this new design loop de-risks big bets. By testing and iterating in live retail settings, brands gain the confidence to roll out winning designs chain-wide — knowing that the data supports the move. Costly mistakes, like launching a redesign that underperforms on shelf, become far less likely. Instead, design becomes a measurable, continuously optimized driver of brand performance.
Driving Lasting Competitive Advantage
In a world where attention is fleeting and brand loyalty is hard-won, shortening the path from insight to action is a powerful advantage. Companies that embed data-driven design loops into their merchandising strategy can move faster, experiment more boldly, and ensure their products don’t just show up — but stand out — on every shelf.
For C-level executives, accelerating the design loop means transforming packaging from a fixed cost into a dynamic lever for growth, margin improvement, and brand leadership.
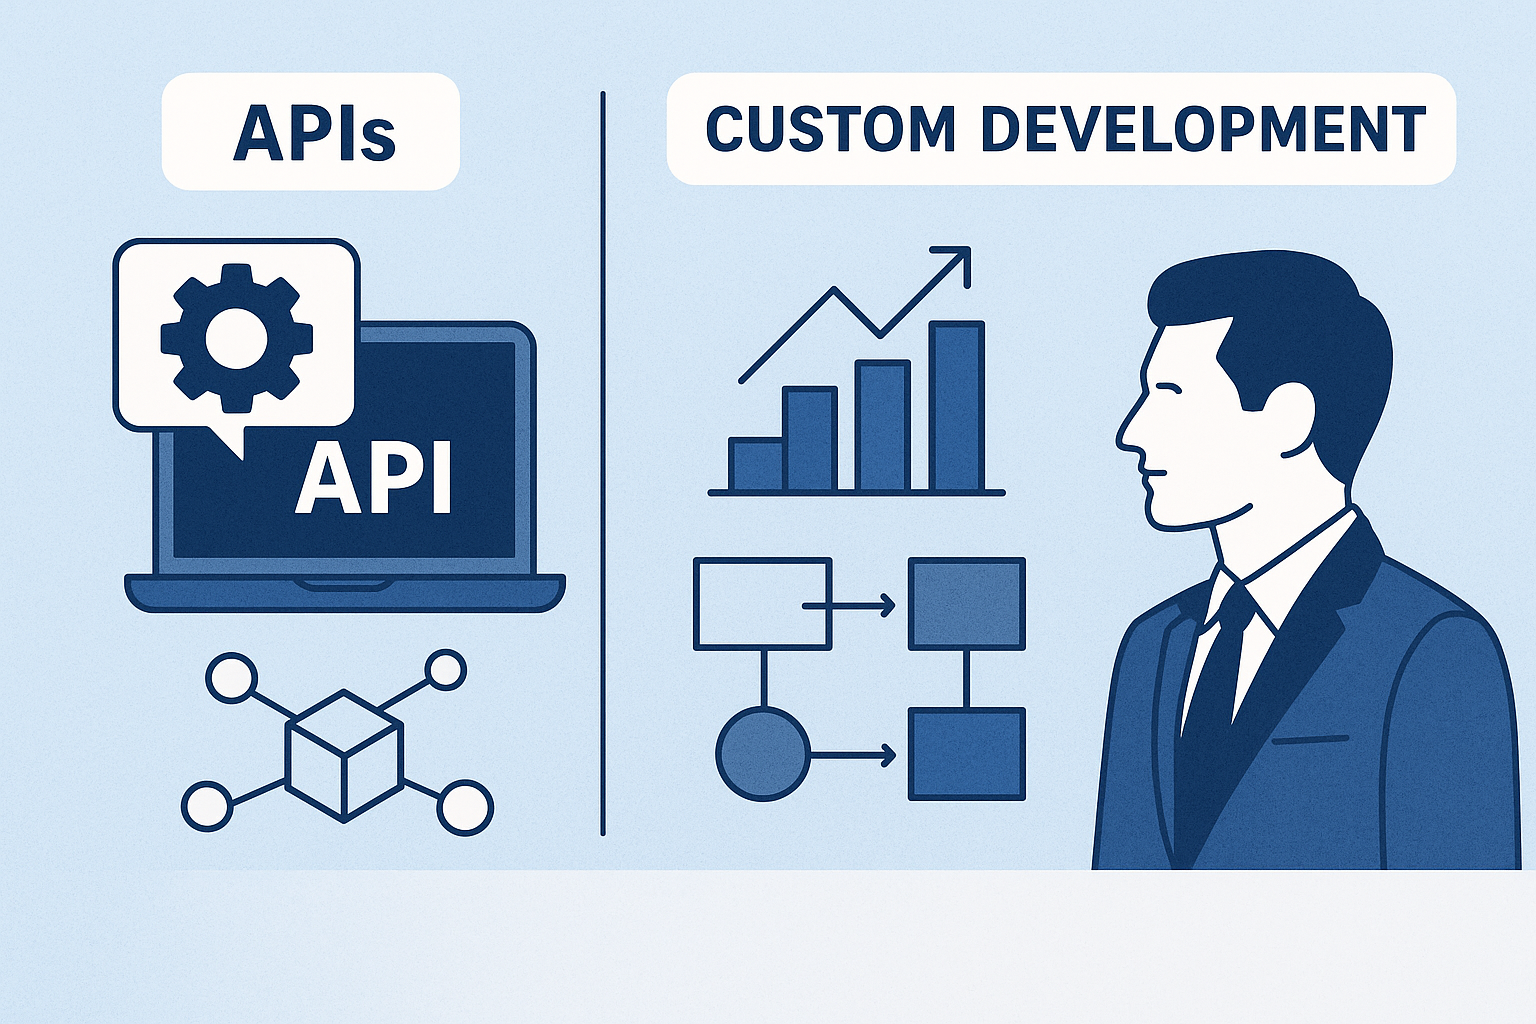
Execution Paths – APIs for Speed, Custom Builds for Moats
Unlocking the value of eye-level optimization and advanced shelf analytics starts with the right technology approach. For executives, the central decision often comes down to speed versus strategic differentiation: Should you move quickly with out-of-the-box solutions, or invest in a custom platform that creates a competitive moat? The right answer depends on both short-term needs and long-term vision.
Ready-Made APIs: Rapid Results, Minimal Overhead
Cloud-based APIs for computer vision have matured dramatically in recent years. With solutions like Brand Recognition, Object Detection, OCR, Background Removal, and Image Labeling, retailers and brands can automate the core analytics pipeline — detecting logos, tracking SKU placement, measuring shelf compliance — within days, not months. These APIs are engineered for ease of integration, requiring minimal IT resources and allowing business teams to pilot new analytics in live stores almost immediately.
For many organizations, these endpoints deliver 80% of the value with just 20% of the effort. They’re ideal for rapid scaling, continuous testing, and portfolio-wide visibility, giving executives real-time insights with virtually no lag between data collection and action. Cloud-based platforms also future-proof your investment, as updates and new features are delivered seamlessly.
Custom Solutions: Precision and Control for Market Leaders
However, not all retail environments are created equal. Highly specialized categories, multilingual labeling requirements, or proprietary planogram logic may demand a more tailored solution. Here, investing in a custom-built computer vision platform — leveraging the expertise of experienced AI partners — can deliver hyper-granular analytics that off-the-shelf tools can’t match.
Custom stacks can be designed for unique workflows, on-premises deployments for privacy or latency, and deep integration with existing BI and ERP systems. Over time, this approach creates a sustainable competitive advantage: as the platform adapts to your evolving needs, it becomes an asset that rivals cannot easily replicate. For companies managing large portfolios, high SKU churn, or sensitive data, a custom vision pipeline quickly pays for itself by driving more precise actions and higher ROI.
Hybrid Approach: Pilot Fast, Scale Smart
A blended strategy is often the most pragmatic. Many organizations start with ready-to-use APIs — delivering immediate business value and proof points — then evolve towards custom solutions as analytics maturity and business complexity grow. This phased approach reduces risk, builds internal capability, and ensures that investments scale with the company’s ambitions.
From Investment to Competitive Edge
For the C-suite, the decision to embrace vision-powered shelf analytics is about more than technology — it’s a strategic lever for operational agility, cost control, and market leadership. Whether deploying turnkey APIs or building a tailored solution, the real ROI comes from transforming data into actionable insights at every level of the organization.
The path you choose today determines how quickly and confidently your teams can adapt to market shifts, optimize shelf presence, and capture every eye-level win — turning advanced analytics into sustained business advantage.
Conclusion – Turning Shelf Pixels into Board-Room Decisions
The science of eye-level optimization is no longer a niche concern for merchandising teams — it is now a board-level imperative for brands and retailers determined to lead in an era defined by data, speed, and shopper attention. In a landscape where every product, logo, and display competes fiercely for consumer engagement, relying on hunches or outdated reports is a risk no forward-thinking executive can afford.
AI-powered shelf analytics have closed the gap between strategy and execution. Every aisle photo, every endcap display, and every logo is now a data point — measurable, benchmarked, and actionable. With modern computer vision, what once took months of manual auditing can now be tracked daily and at scale, arming C-level leaders with the clarity to make fast, market-responsive decisions.
For executives, the value proposition is direct and substantial:
Improved revenue and margin through higher product visibility and smarter trade spend.
Faster packaging and design innovation cycles, eliminating costly missteps and guesswork.
Data-driven interventions that target non-compliance, optimize planograms, and surface growth opportunities across the entire retail network.
Strategic flexibility to adapt technology deployment — leveraging powerful APIs for speed or custom solutions for deep market advantage.
The transition from static shelf snapshots to real-time, actionable KPIs is transforming how organizations compete and win. Eye-level shelf placement, once a best practice, is now a quantifiable metric that directly drives EBITDA and long-term enterprise value. Brands leveraging these tools not only stand out in the aisle but also strengthen their strategic position in the boardroom.
Ultimately, the most successful organizations will be those that turn shelf pixels into boardroom priorities — connecting what happens at eye level with every level of business performance. In this new era of visual intelligence, the ability to see, measure, and act on shelf reality is no longer optional. It is the new foundation for sustainable retail leadership and growth.